Link Report
Insights into how file and resource links are shared via email across your organisation.
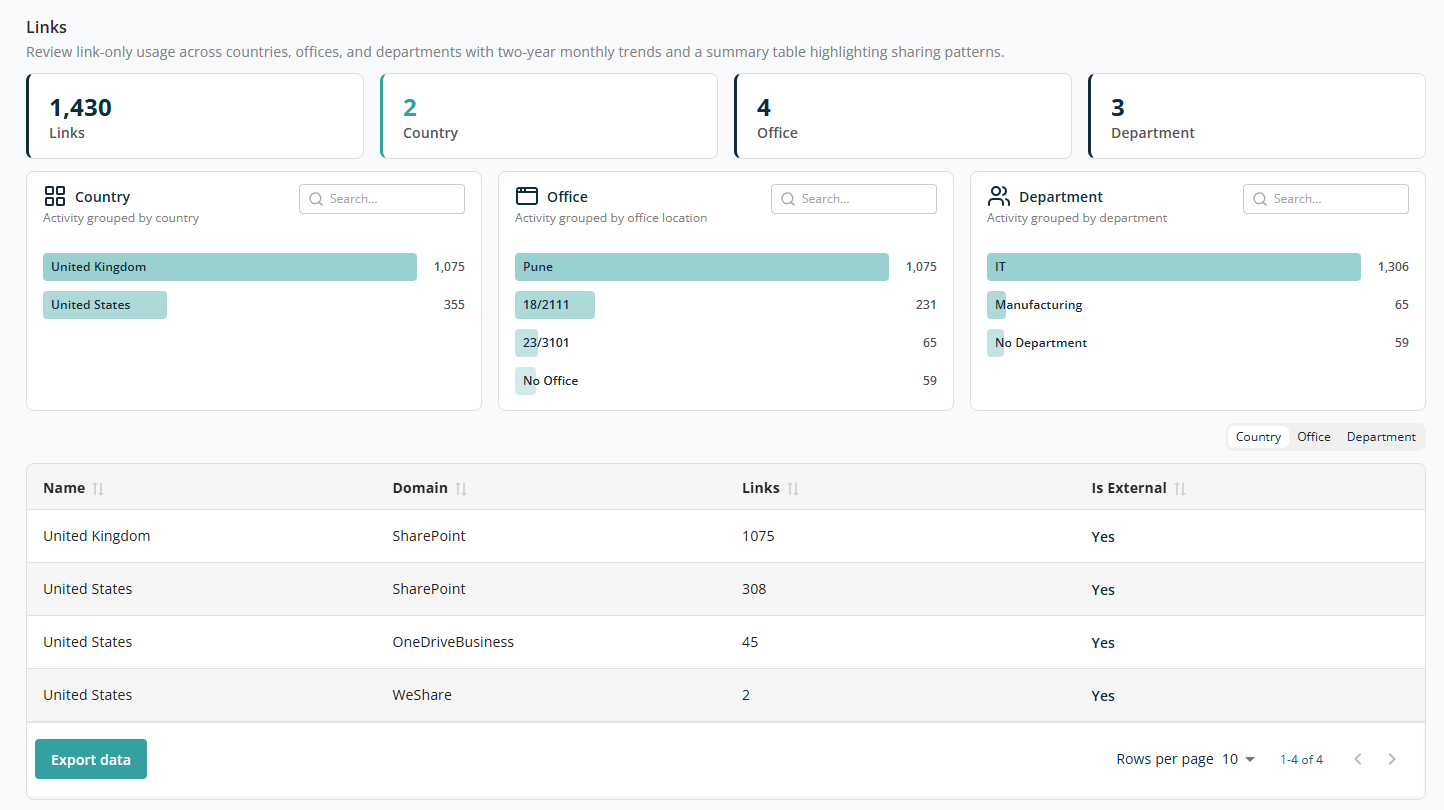
The Links report provides insights into how file and resource links are shared via email across your organisation. It helps you analyse link-sharing patterns by country, office location, and department, enabling better monitoring of external access and data exposure risks.
Overview
The top section provides a quick summary of link activity:
- Link — Total number of links shared via email.
- Country — Number of countries contributing to link-sharing activity.
- Office — Number of office locations involved.
- Department — Number of departments contributing to link usage.
Analytical Insights
The section provides visual breakdowns to help you understand email usage patterns:
- Country — Number of links grouped by country. Helps to identify where most links are being shared geographically. Use the Search box to locate data by country.
- Office — Number of links grouped by office location. Useful for identifying activity from specific office locations. Use the Search box to locate data by office name.
- Department — Number of links grouped by department. Helps assess department-wise data sharing behaviour. Use the Search box to locate data by department name.
Each individual bar shown in a widget is clickable and acts as a filter for the data. Clicking a bar filters the entire report by that selection, and the selected criteria are displayed at the top.
Data Table
The table provides a comparative summary of link activity. Columns:
- Name — The selected grouping (e.g. country, office, or department).
- Domain — The platform from which the link originates, e.g. SharePoint, OneDriveBusiness, WeShare.
- Links — Number of links shared.
- Is External — Whether the emails involve external recipients.
Yesmeans those are emails sent to an external domain.
Above the table, three tabs let you view the data by Country, Office, and Department. Based on the selected tab, the Name column shows the corresponding value.
The table supports sorting on all columns.
The Export Data button at the bottom left lets you download the report for offline analysis or reporting.
At the bottom right of the table:
- Rows Per Page — 5, 10, 15, 20, 25, 30, 50, or 100. Default: 10.
- Total Record Count — Range and total record count.
- Next/Previous Navigation — Arrow icons to navigate.