Dashboard — Overview
The Dashboard provides a high-level view of the health, risks, and compliance status of your Microsoft 365 workspace.
The Dashboard is the default landing page for Tenant Admin users after sign-in. It surfaces workspace health, governance insights, compliance indicators, and data quality metrics so that risk areas and trends can be identified and prioritised for remediation.
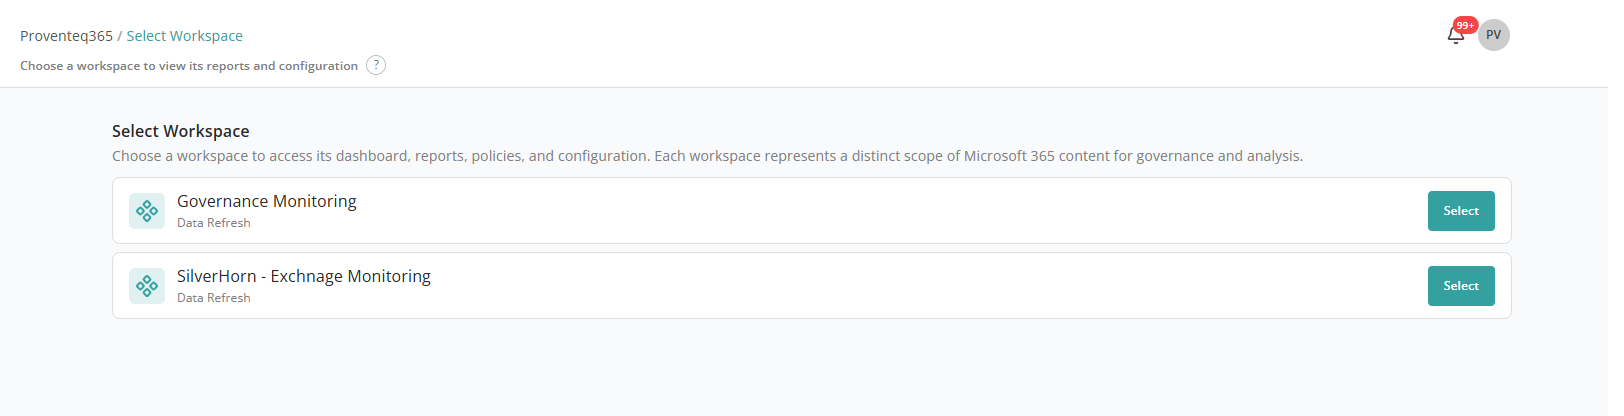
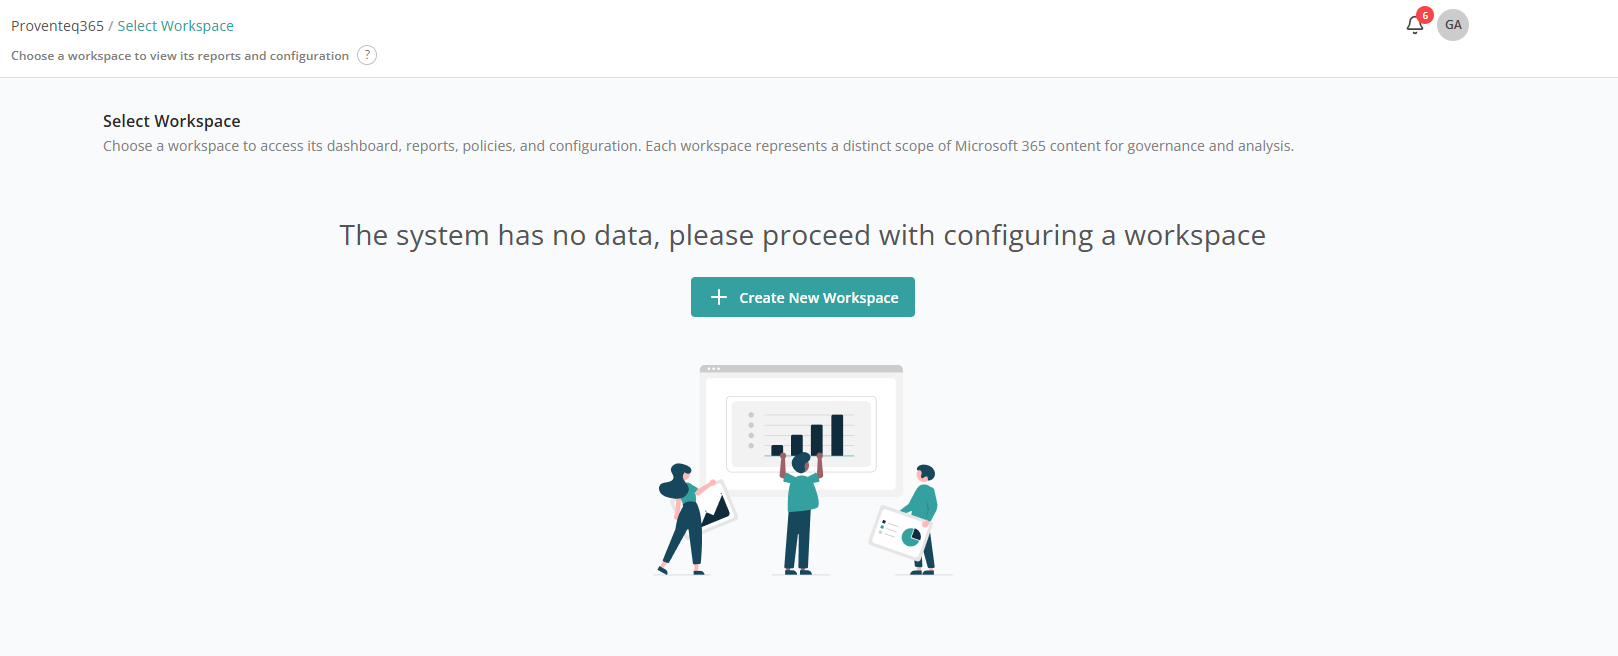
The Dashboard landing page shows a list of existing workspaces to choose from. If no workspace is present yet, it shows a page with a Create new workspace button.
To open the Dashboard, select the workspace to analyse from the workspace selector at the top of the screen. Once a workspace is selected, the Dashboard populates the summaries and charts described below.
Navigation Tabs
At the top of the Dashboard you can switch between different governance focus areas:
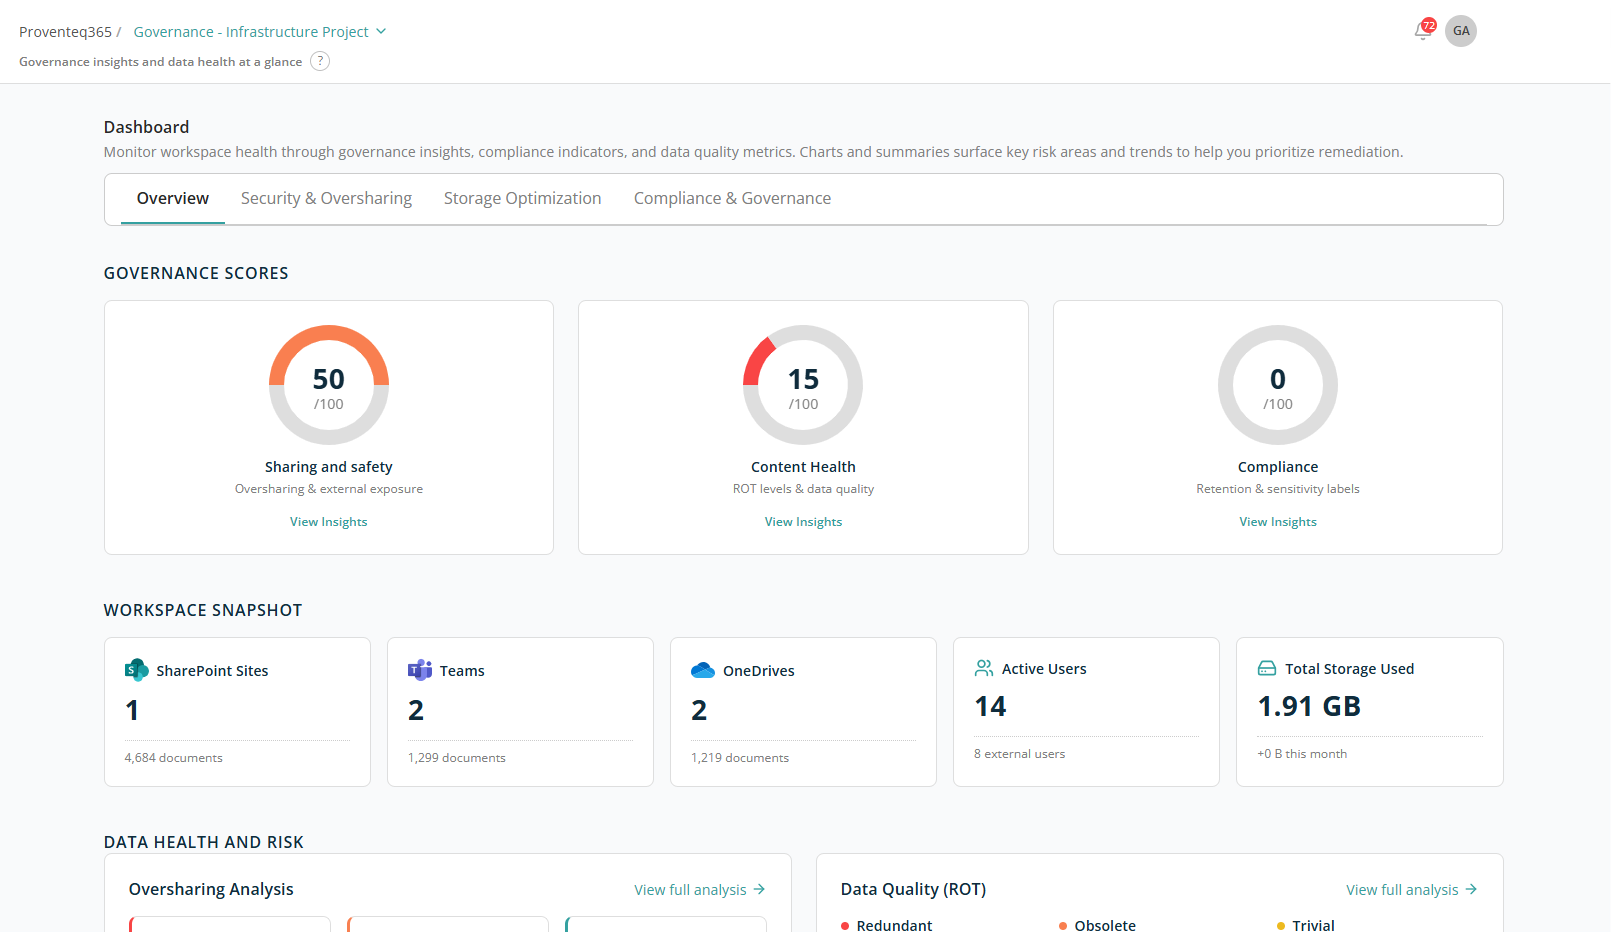
- Overview — Consolidated governance scores, workspace snapshot, and data health summary. (This page.)
- Security & Oversharing — Risk summary and detailed breakdown of sharing, access, and permission risks.
- Storage Optimization — Redundant, obsolete, and trivial content metrics to help optimise storage.
- Compliance & Governance — Active policies, files matched, and auto-remediation status.
Governance Scores
This section displays overall governance scores on a 0–100 scale, helping you quickly assess risk levels.
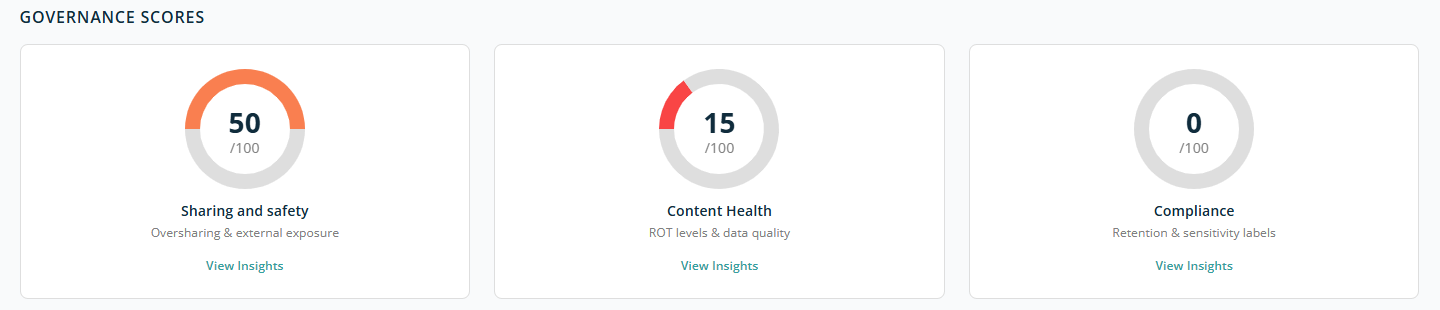
Three ring charts are displayed side by side, each showing a score out of 100 along with a short description and a View insights link:
- Sharing and Safety — Highlights issues related to oversharing and external user access. Lower scores indicate higher exposure risk.
- Content Health — Reflects the quality of content based on ROT analysis. Lower scores indicate healthy content with less presence of redundant, obsolete, or trivial content.
- Compliance — Score reflecting adherence to configured governance policies.
Each card includes a View Insights link to open the relevant tab.
Workspace Snapshot
This section provides a quick summary of the workspace environment.
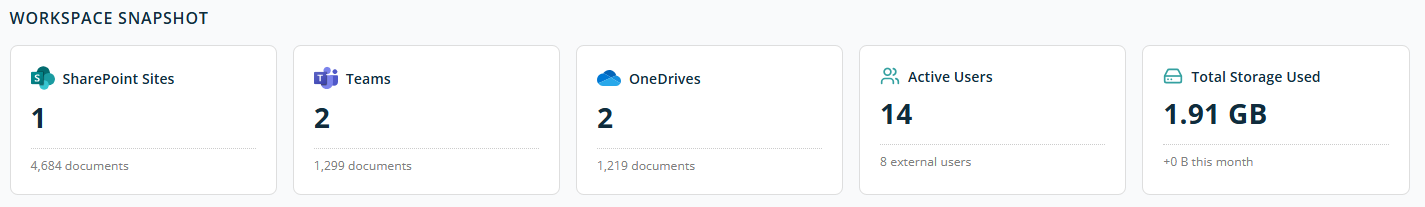
- SharePoint Sites — Total number of sites and number of documents stored in them.
- Teams — Number of Teams and number of documents stored in them.
- OneDrives — Number of user OneDrives and number of documents stored in them.
- Active Users — Count of active users, including external users.
- Total Storage Used — Combined storage consumption and monthly growth.
Data Health and Risk
This section highlights areas where data may pose security risks or storage inefficiencies. It focuses on two key aspects:
- Oversharing risks
- Data quality (ROT)
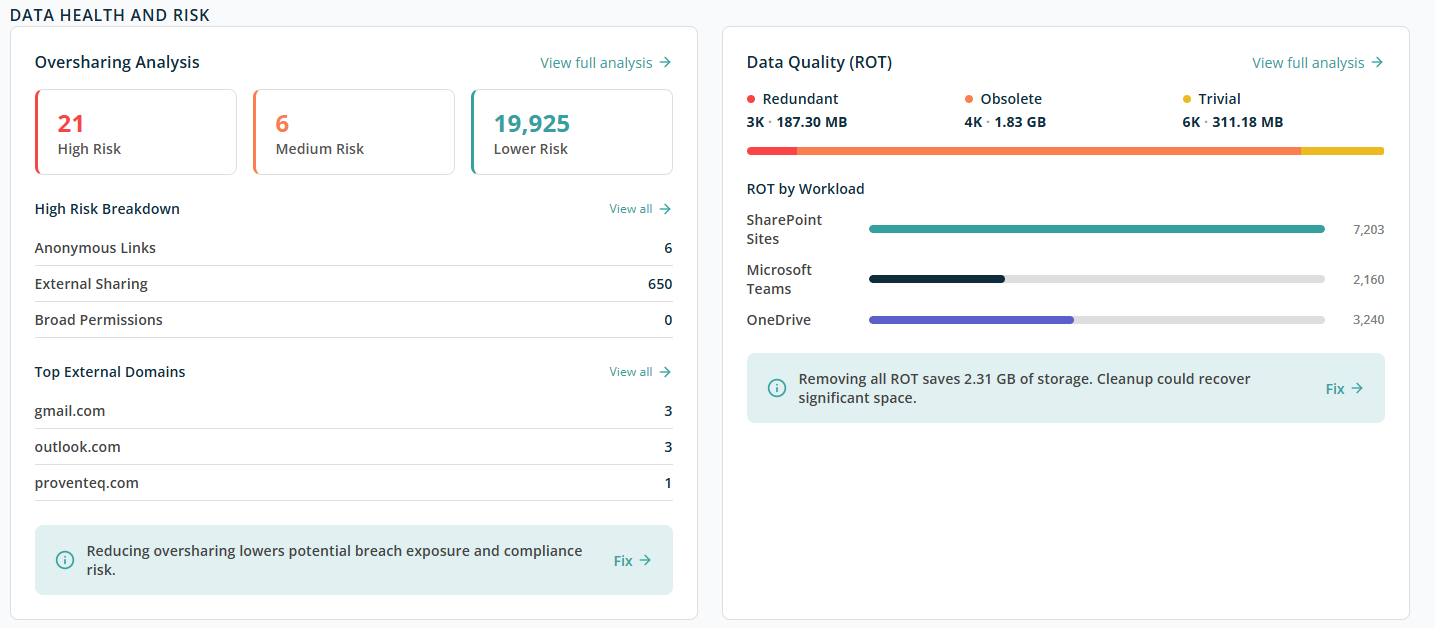
Oversharing Analysis
The Oversharing Analysis panel shows how much content is shared beyond recommended levels and categorises it by risk.
Risk Levels:
- High Risk — Content with the greatest exposure, such as anonymous links or sensitive data shared externally.
- Medium Risk — Content shared externally or broadly but with some limitations.
- Lower Risk — Content shared in a more controlled or restricted manner.
High Risk Breakdown — Explains why content is classified as high risk:
- Anonymous Links — Files or folders accessible via links that do not require sign-in.
- External Sharing — Content shared with users outside your organisation.
- Broad Permissions — Content shared with large internal groups such as "Everyone" or "All Users".
Top External Domains — Shows the most common external domains with which data is shared (for example, gmail.com or outlook.com). Helps identify unintended or risky external collaboration patterns.
Select View all to open a detailed report.
Recommended Action — An information message "Reducing oversharing lowers potential breach exposure and compliance risk" appears at the bottom. Select Fix to move on to the Security & Oversharing section for remediation actions.
At the top right of the panel, click View full analysis to open the detailed report.
Data Quality (ROT)
The Data Quality (ROT) panel focuses on unnecessary data stored in the environment.
ROT stands for:
- Redundant — Duplicate or unnecessary copies of content.
- Obsolete — Outdated content no longer needed.
- Trivial — Low-value content with little business relevance.
ROT Summary:
- Number of files in each ROT category.
- Total storage consumed by each category.
The colour-coded bar visually represents how much space each category occupies.
ROT by Workload — Shows where ROT data exists across workloads: SharePoint Sites, Microsoft Teams, OneDrive.
Storage Recovery Insight — An informational message highlights the total storage that could be reclaimed if ROT data is removed (for example, 2.31 GB). Select Fix to move on to the Storage Optimization section for cleanup if required.